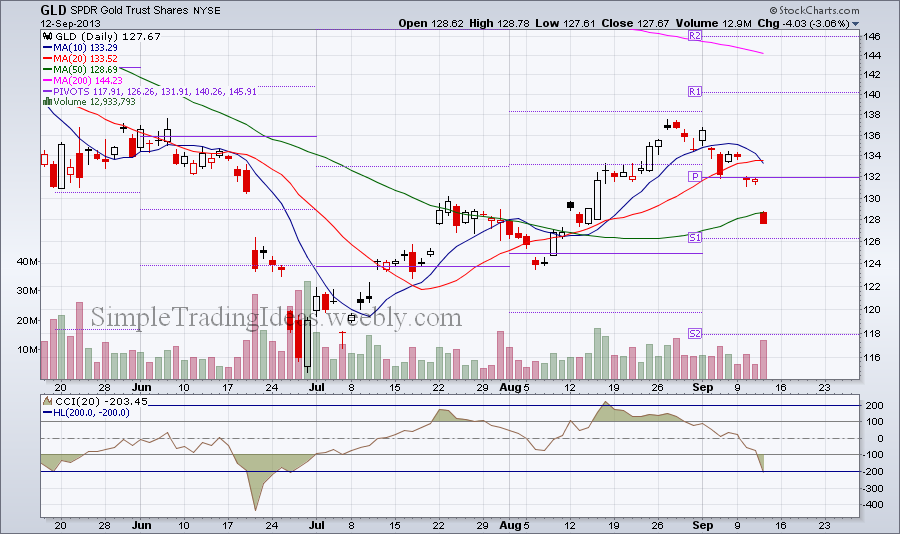
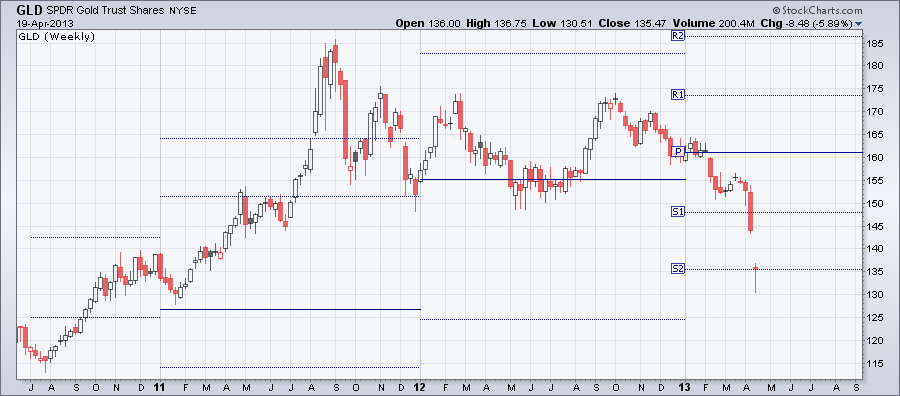
Gold stocks (GLD) and gold mining stocks (GDX, GDXJ) sharply fell during the past week and a half. It looks like the late June-August advance was a correction wave in the bigger downtrend. Pivot points can be helpful to indentify short term supports. S1 or more likely S2 could be such a possible support, see the chart below. The Commodity Chanel Index below the price chart is a momentum oscillator and helpful to identify the strength of a trend and trend reversals. Notice that CCI is below 200 the first time since June. CCI can also be used to spot overbought and oversold conditions.
0 Comments
It looks like a bear flag bearish continuation pattern is forming on the 60 minute chart below. The chart is showing SPY with the Aroon indicator below the chart. The Aroon indicator is telling us if the stock is trending or not and how strong is the trend. The moving averages and the pivot points are helping us to determine the next support.
The weekly chart below shows SPY with PPO, which is similar to MACD and StochRSI oscillators. PPO is quite high and although SPY reached higher highs StochRSI didn't reach higher highs. Also notice that SPY already reached the yearly R2 pivot resistance. So what are the chances that it will move higher?
I posted yesterday about Pivot Points. On the chart below I want to show you how it worked out today. This is a 15-minute chart for the past three days with the daily pivot points. As you can see SPY showed strength this morning and moved all the way up to R2 resistance. It didn't hold there, quickly turned around and moved all the way down to S2 support. This is an oversold area where SPY bounced back but couldn't break the pivot point resistance. The morning strength turned into weakness.
Pivot Points are leading indicators. They "predict" price movements in the future, next day, next week, next year depending on the time frame. Once they are calculated for the current day, week, month, year they don't change. They originally used by floor traders the original day traders to set key levels for the next day.
Pivot Points are calculated from the previous day, week, month or year from the previous close, high and low. There are different types of Pivot Points and their calculation is different. The results of the calculation are the Pivot Point and the support and resistance pivots. The Standard Pivot Points have two support and two resistance levels. The calculation is the following: Pivot Point (P) = (High + Low + Close)/3 Support 1 (S1) = (P x 2) - High Support 2 (S2) = P - (High - Low) Resistance 1 (R1) = (P x 2) - Low Resistance 2 (R2) = P + (High - Low) A move above the Pivot Point shows strength and breaking above R1 and R2 shows even more strength in an uptrend. When prices move below the Pivot Point it demonstrates weakness. When prices reach R2 they are considered overbought and when they reach S2 they are oversold. The chart below shows the monthly Pivot Points for SPY. As you can see prices are in the R2 area. SPY is short term overbought and going thru consolidation. Depending which way SPY will move next week we will see if this consolidation will result in strength or further weakness. |
Loading
Search Site
Links
Archives
September 2014
Categories
All
|